Note
Go to the end to download the full example code
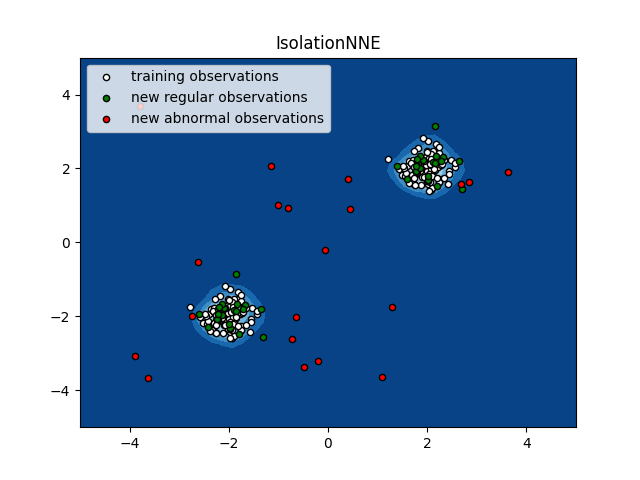
IsolationNNE example
An example using inne.IsolationNNE for anomaly
detection.
import numpy as np
import matplotlib.pyplot as plt
from inne import IsolationNNE

rng = np.random.RandomState(42)

# Generate train data
X = 0.3 * rng.randn(100, 2)
X_train = np.r_[X + 2, X - 2]
# Generate some regular novel observations
X = 0.3 * rng.randn(20, 2)
X_test = np.r_[X + 2, X - 2]
# Generate some abnormal novel observations
X_outliers = rng.uniform(low=-4, high=4, size=(20, 2))

# fit the model
clf = IsolationNNE()
clf.fit(X_train)
y_pred_train = clf.predict(X_train)
y_pred_test = clf.predict(X_test)
y_pred_outliers = clf.predict(X_outliers)

# plot the line, the samples, and the nearest vectors to the plane
xx, yy = np.meshgrid(np.linspace(-5, 5, 50), np.linspace(-5, 5, 50))
Z = clf.decision_function(np.c_[xx.ravel(), yy.ravel()])
Z = Z.reshape(xx.shape)

plt.title("IsolationNNE")
plt.contourf(xx, yy, Z, cmap=plt.cm.Blues_r)

b1 = plt.scatter(X_train[:, 0], X_train[:, 1], c="white", s=20, edgecolor="k")
b2 = plt.scatter(X_test[:, 0], X_test[:, 1], c="green", s=20, edgecolor="k")
c = plt.scatter(X_outliers[:, 0], X_outliers[:, 1],
                c="red", s=20, edgecolor="k")
plt.axis("tight")
plt.xlim((-5, 5))
plt.ylim((-5, 5))
plt.legend(
    [b1, b2, c],
    ["training observations", "new regular observations", "new abnormal observations"],
    loc="upper left",
)
plt.show()
Total running time of the script: (0 minutes 0.579 seconds)