inne.IsolationNNE
- class inne.IsolationNNE(n_estimators=200, max_samples='auto', contamination='auto', random_state=None)[source]
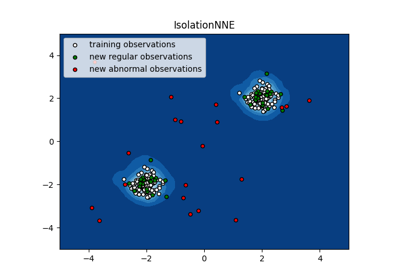
Isolation-based anomaly detection using nearest-neighbor ensembles.
The INNE algorithm uses the nearest neighbour ensemble to isolate anomalies. It partitions the data space into regions using a subsample and determines an isolation score for each region. As each region adapts to local distribution, the calculated isolation score is a local measure that is relative to the local neighbourhood, enabling it to detect both global and local anomalies. INNE has linear time complexity to efficiently handle large and high-dimensional datasets with complex distributions.
- Parameters
- n_estimatorsint, default=200
The number of base estimators in the ensemble.
- max_samplesint, default=”auto”
The number of samples to draw from X to train each base estimator.
If int, then draw max_samples samples.
If float, then draw max_samples * X.shape[0]` samples.
If “auto”, then max_samples=min(8, n_samples).
- contamination“auto” or float, default=”auto”
The amount of contamination of the data set, i.e. the proportion of outliers in the data set. Used when fitting to define the threshold on the scores of the samples.
If “auto”, the threshold is determined as in the original paper.
If float, the contamination should be in the range (0, 0.5].
- random_stateint, RandomState instance or None, default=None
Controls the pseudo-randomness of the selection of the feature and split values for each branching step and each tree in the forest.
Pass an int for reproducible results across multiple function calls. See Glossary.
References
- 1
T. R. Bandaragoda, K. Ming Ting, D. Albrecht, F. T. Liu, Y. Zhu, and J. R. Wells. “Isolation-based anomaly detection using nearest-neighbor ensembles.” In Computational Intelligence, vol. 34, 2018, pp. 968-998.
Examples
>>> from inne import IsolationNNE
>>> import numpy as np
>>> X =  [[-1.1], [0.3], [0.5], [100]]
>>> clf = IsolationNNE().fit(X)
>>> clf.predict([[0.1], [0], [90]])
array([ 1,  1, -1])
- decision_function(X)[source]
Average anomaly score of X of the base classifiers.
The anomaly score of an input sample is computed as the mean anomaly score of the .
- Parameters
- Xarray-like of shape (n_samples, n_features)
The input samples. Internally, it will be converted to
dtype=np.float32.
- Returns
- scoresndarray of shape (n_samples,)
The anomaly score of the input samples. The lower, the more abnormal. Negative scores represent outliers, positive scores represent inliers.
- fit(X, y=None)[source]
Fit estimator.
- Parameters
- Xarray-like of shape (n_samples, n_features)
The input samples. Use
dtype=np.float32for maximum efficiency.- yIgnored
Not used, present for API consistency by convention.
- Returns
- selfobject
Fitted estimator.
- predict(X)[source]
Predict if a particular sample is an outlier or not.
- Parameters
- Xarray-like of shape (n_samples, n_features)
The input samples. Internally, it will be converted to
dtype=np.float32and if a sparse matrix is provided to a sparsecsr_matrix.
- Returns
- is_inlierndarray of shape (n_samples,)
For each observation, tells whether or not (+1 or -1) it should be considered as an inlier according to the fitted model.
- score_samples(X)[source]
Opposite of the anomaly score defined in the original paper. The anomaly score of an input sample is computed as the mean anomaly score of the trees in the forest.
- Parameters
- Xarray-like of shape (n_samples, n_features)
The input samples.
- Returns
- scoresndarray of shape (n_samples,)
The anomaly score of the input samples. The lower, the more abnormal.